What Is the Average Tip Percentage at US Restaurants?
Survey data, trends, and benchmarks on average restaurant tip percentages in the United States — broken down by service type and compared over time.
- average tip percentage
- tipping statistics
- restaurant tips
- tipping trends
Disclaimer: Tipping customs vary; the amounts in this article reflect commonly cited US norms and survey data, not legal requirements. Individual tipping behavior varies widely.
The average tip percentage in the United States is a moving target — it has shifted measurably over the past decade, varies by restaurant type, and is influenced by payment technology, economic conditions, and generational attitudes. This article summarizes the best available data on where average tipping stands today.
Use our tip calculator to apply any tip percentage to your specific bill.
The Headline Number
According to restaurant payment data compiled by Square and Toast (point-of-sale providers with large transaction datasets), the average restaurant tip in the US runs approximately 19–20% for full-service sit-down dining. This is up from the historical baseline of 15–17% that prevailed through most of the 2000s.
Bankrate’s consumer tipping surveys corroborate this: the majority of respondents report that they leave 20% as their standard tip at sit-down restaurants when service is good.
Average Tip Percentage by Restaurant Type
Not all dining occasions are equal. Tip norms differ significantly by format:
| Restaurant Type | Average Tip Range | Notes |
|---|---|---|
| Fine dining | 20–25% | Higher bill totals; more complex service expectations |
| Casual sit-down (Applebee’s, Chili’s tier) | 18–20% | Most common dining format in the US |
| Independent / local restaurants | 18–22% | Slight lean toward higher tips as a “support local” behavior |
| Coffee shops / cafés | 0–15% (highly variable) | Counter service; no table service standard applies |
| Fast casual (Chipotle, Panera) | 0–10% | Low expectation; tip prompts increasingly present but not obligatory |
| Food delivery (app-based) | 10–20% of order; $3–5 minimum common | Driver tips are structurally different from restaurant tips |
| Bars (full tab) | 18–20% of tab | Per-drink tipping of $1–2 also common |
How Average Tips Have Changed Over Time
The shift from 15% to 20% as the “standard” tip happened gradually over roughly 20 years, driven by several factors:
Rising awareness of tipped wages: Increased media coverage of the federal tipped minimum wage ($2.13/hour since 1991) has led many diners to consciously tip more as a supplement to low base wages.
Point-of-sale technology: When restaurants moved to tableside card readers and iPad-based POS systems, the default prompt options (typically 18%, 20%, 22%, or 25%) anchored diners at higher starting points. Research by payment processors has found that even small changes to the default tip suggestion meaningfully shift the average tip.
Pandemic-era support: During 2020–2021, many diners who could afford to eat out increased their tips significantly in recognition of the risk and difficulty service workers faced. Some of this elevated behavior persisted post-pandemic.
Tip creep / tip fatigue: Counter-intuitively, the proliferation of tip prompts in non-service contexts (self-checkout, counter service, food trucks) has also generated pushback. Surveys by Bankrate found that a majority of Americans feel that tipping expectations have become excessive in contexts outside of traditional table service.
Tipping by Generation
Survey data (Bankrate, CNBC) consistently shows variation in tipping behavior by age group:
| Generation | Tipping Behavior (General) |
|---|---|
| Baby Boomers (1946–1964) | Most consistent tippers; often cite 15–20% as their norm |
| Gen X (1965–1980) | 18–20% common; high reliability |
| Millennials (1981–1996) | Most likely to use apps; median around 18–20% |
| Gen Z (1997–2012) | Most variable; highest rate of declining tip prompts at counter service |
Note: These are broad generalizations from survey data — individual behavior varies substantially.
How Tips Relate to Server Income
Understanding average tipping in isolation misses the structural context.
The federal tipped minimum wage has been $2.13 per hour since 1991, unchanged for over three decades. States can (and many do) set higher tipped minimums. As of 2024:
- 7 states require servers to receive the full state minimum wage before tips (including California, Washington, and Minnesota)
- The majority of states still allow the federal tip credit, meaning the base wage can be as low as $2.13/hour
For a server earning $2.13/hour working an 8-hour shift, base pay is $17.04 before taxes. Tips on a typical busy Saturday night shift where a server turns 15–20 tables can range from $100–$300+ depending on the restaurant and check averages.
The Bureau of Labor Statistics reports median hourly wages for food servers (including tips) at roughly $14–$20/hour nationally, but this masks enormous variation between high-volume urban restaurants and slower suburban ones.
What “Average” Actually Tells You
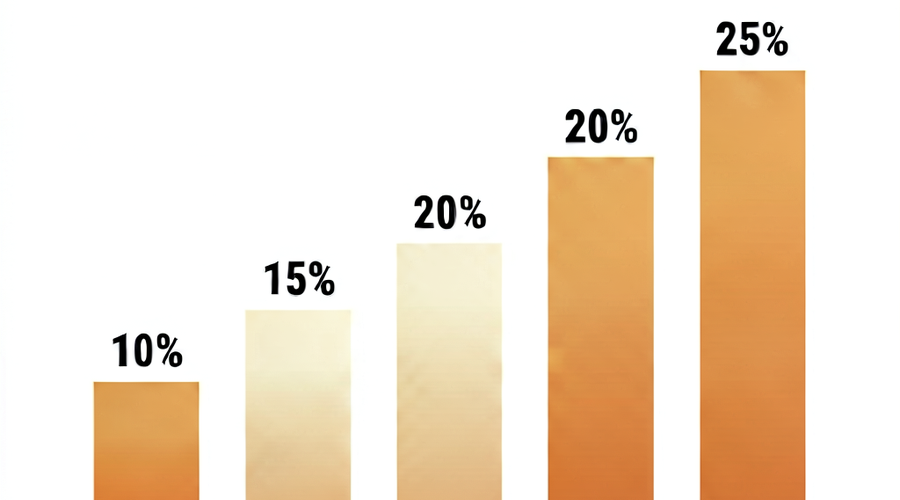
The average tip percentage is a useful benchmark but shouldn’t mechanically drive your tipping decisions. The range of reasonable tipping — 15% for adequate service to 25% for exceptional service — is wide enough that the “average” is less meaningful than your read of the actual service you received.
What the data does confirm:
- 20% has replaced 15% as the social baseline for good service at a sit-down restaurant
- Tips below 15% are widely read as a negative signal — not just low, but a comment on service
- Counter-service tips are genuinely optional — though appreciated — and should not be guilt-induced by a pointed touchscreen
Quick Reference: What Different Tip Levels Signal
| Tip % | What It Generally Communicates |
|---|---|
| 0–5% | Severe dissatisfaction or an error (usually sent with an explanation) |
| 10% | Below standard; may signal disappointment with service |
| 15% | Historically “adequate”; now reads as slightly low in many markets |
| 18% | Solid baseline; appropriate for good service |
| 20% | The new standard for good service in the US |
| 22–25% | Above-average recognition of excellent service |
| 25%+ | Exceptional service or a deliberate generous choice |
Use our tip calculator to calculate any percentage on your specific bill — or to see what different tip levels translate to in dollar amounts before you decide.